Historical Yield Analysis
Historical Yield Analysis is for looking at performance over time instead of only looking at the latest APY snapshot.
In Monarch, this is most useful when you want to understand:
- how yield changed over time
- how much each market contributed to a position
- whether a strategy was actually worth the complexity
What it is for
Monarch groups positions by loan asset on the same network.
From there, the analysis breaks the position down by market over time and shows how yield was generated across those markets.
This can also be used to analyze vaults and their performance over time.
Example: analysis view
This view shows the time-weighted distribution and yield generated breakdown for a grouped position.
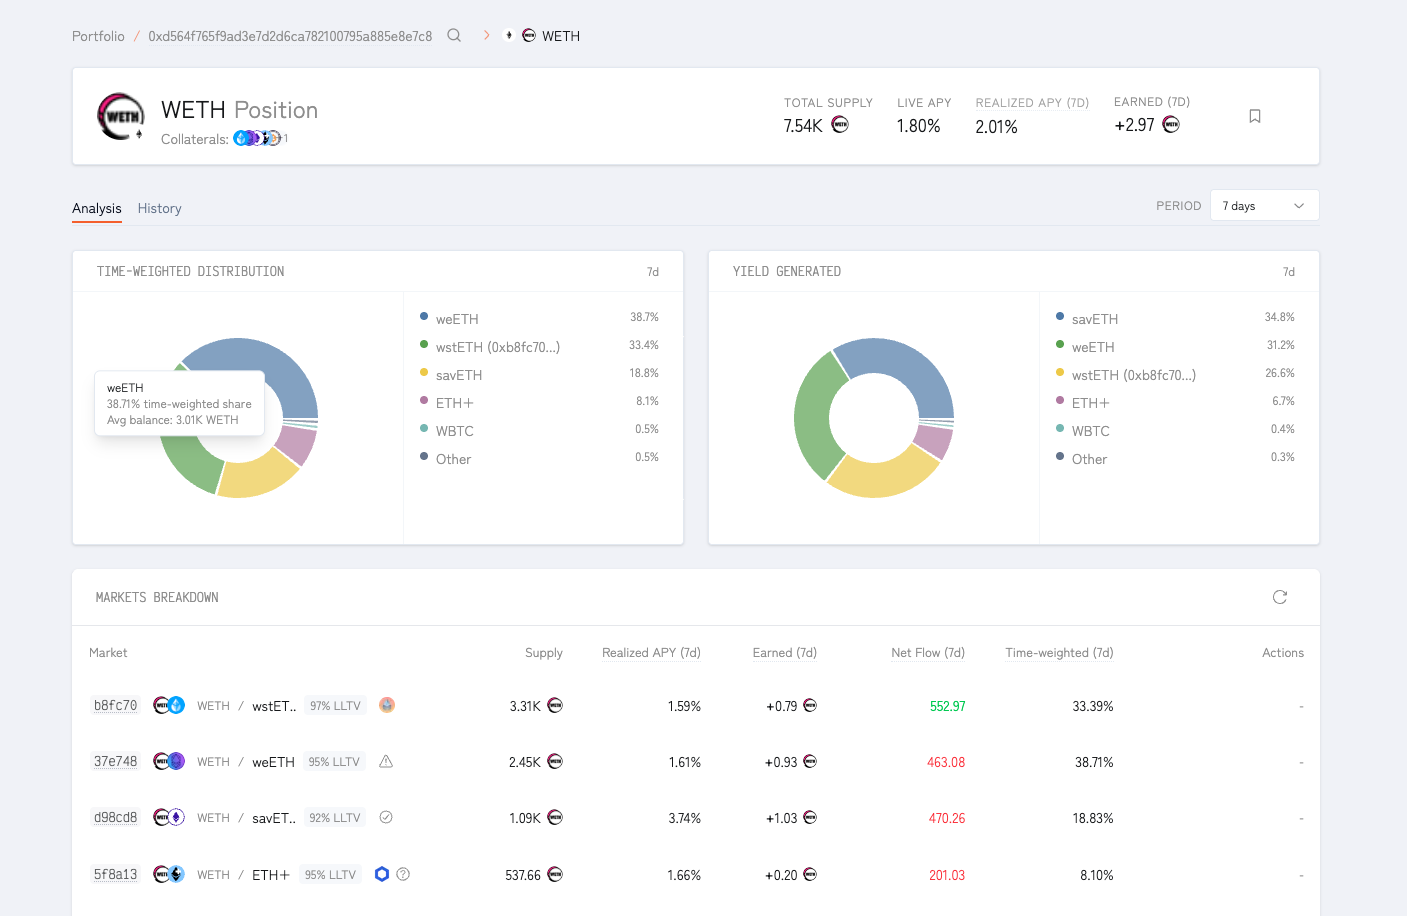
This is the useful part: you can see which markets actually carried the position.
For example:
- one market may have had the largest time-weighted share
- another may have generated more yield than its weight would suggest
That makes it easier to judge whether your allocation was efficient, or whether some markets were mostly taking up room without earning much.
Example: history view
The history view shows how the grouped position changed over time.
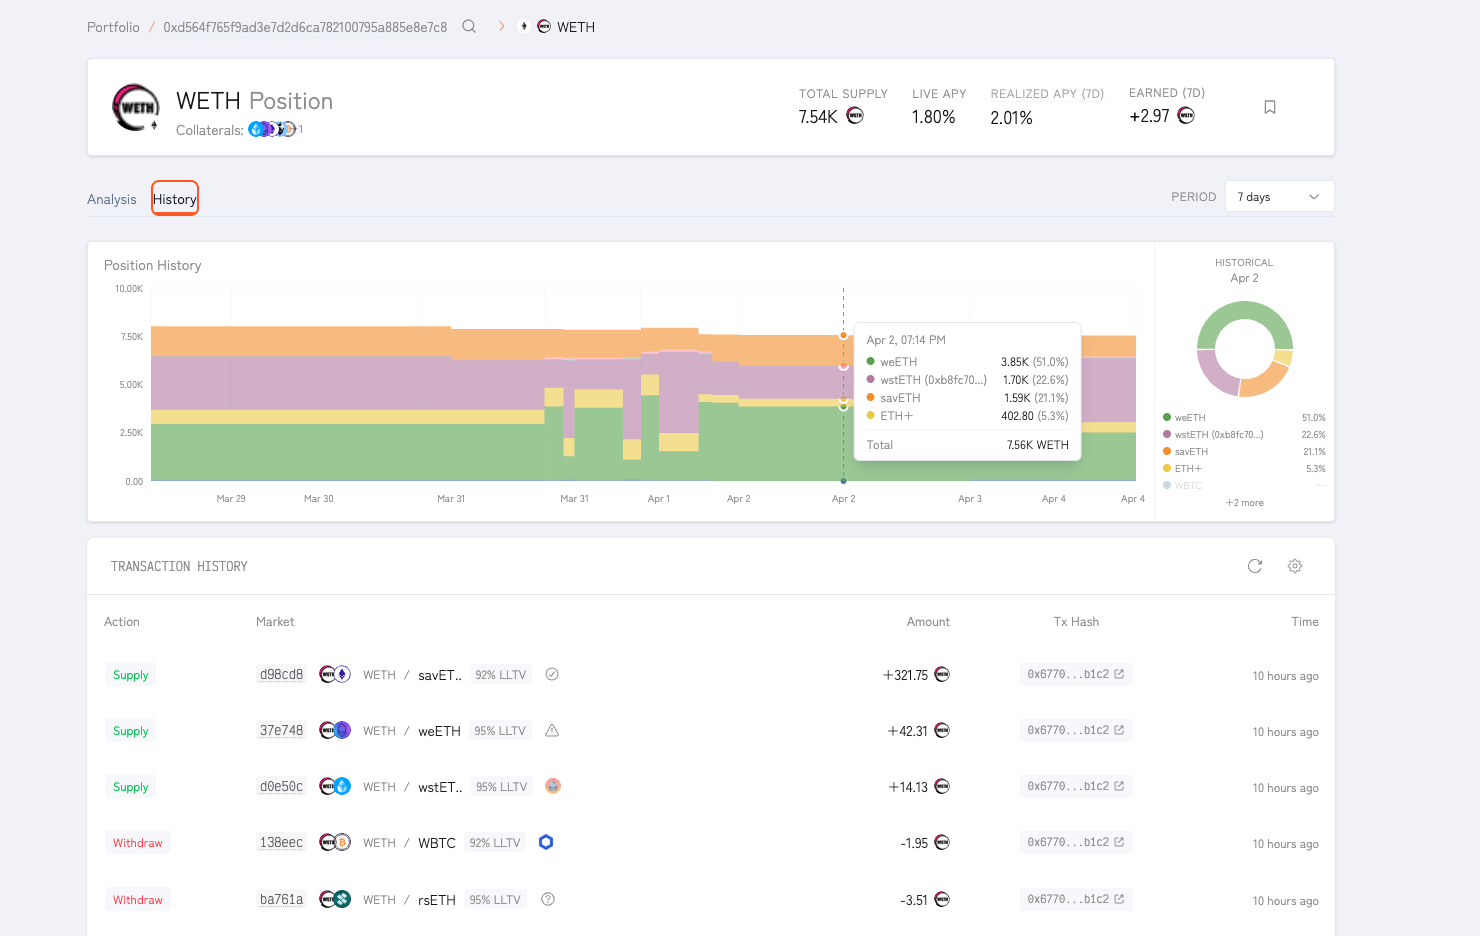
This is useful for understanding:
- how the balance moved between markets
- when supply and withdraw activity changed the composition
- what the grouped position looked like at a specific point in time
Practical use
Historical Yield Analysis is useful when you want to answer questions like:
- which market actually generated most of my yield?
- did one market carry the whole position?
- was I diversified in a useful way?
- did the position improve after I reallocated?