Market Analysis
Monarch's market page has four tabs:
- Trend
- Analysis
- Activities
- Positions
For structure and risk, the key parts are in Analysis.
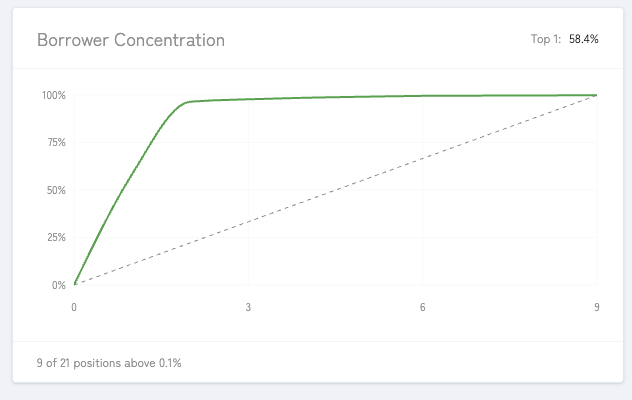
Concentration chart
Monarch shows concentration on both the supplier side and the borrower side.
The chart compares the actual cumulative distribution against an equal-distribution baseline, and also surfaces checkpoints like:
- Top 1
- Top 10
- Top 100
A flatter curve means positions are more evenly distributed.
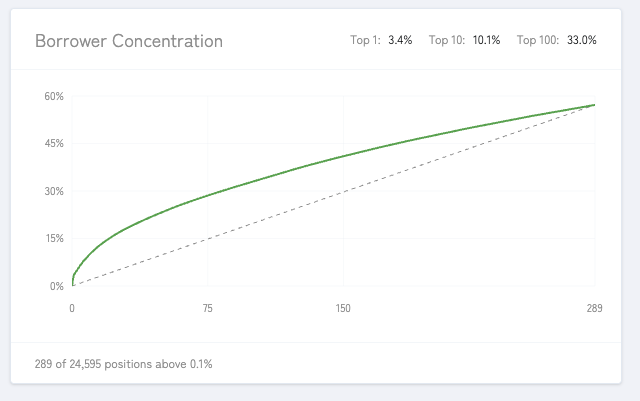
A steeper curve means the market is more centralized in a small number of positions.
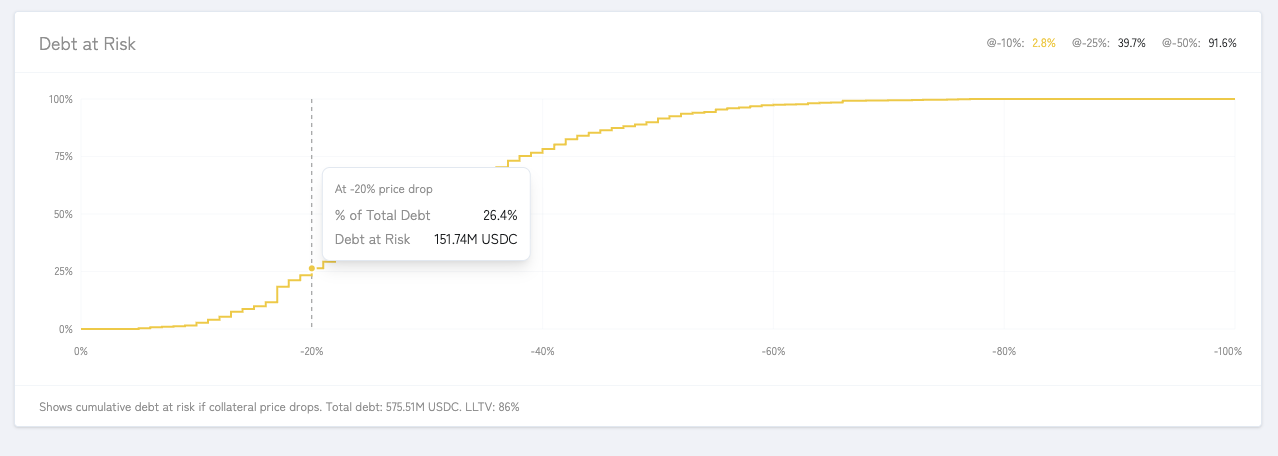
Capital at risk
The Debt at Risk chart shows how much market debt becomes vulnerable as collateral prices fall.
Monarch highlights checkpoints like:
- debt at risk at -10%
- debt at risk at -25%
- debt at risk at -50%
Use it to judge whether liquidation pressure builds gradually or becomes dangerous after a relatively small price move.